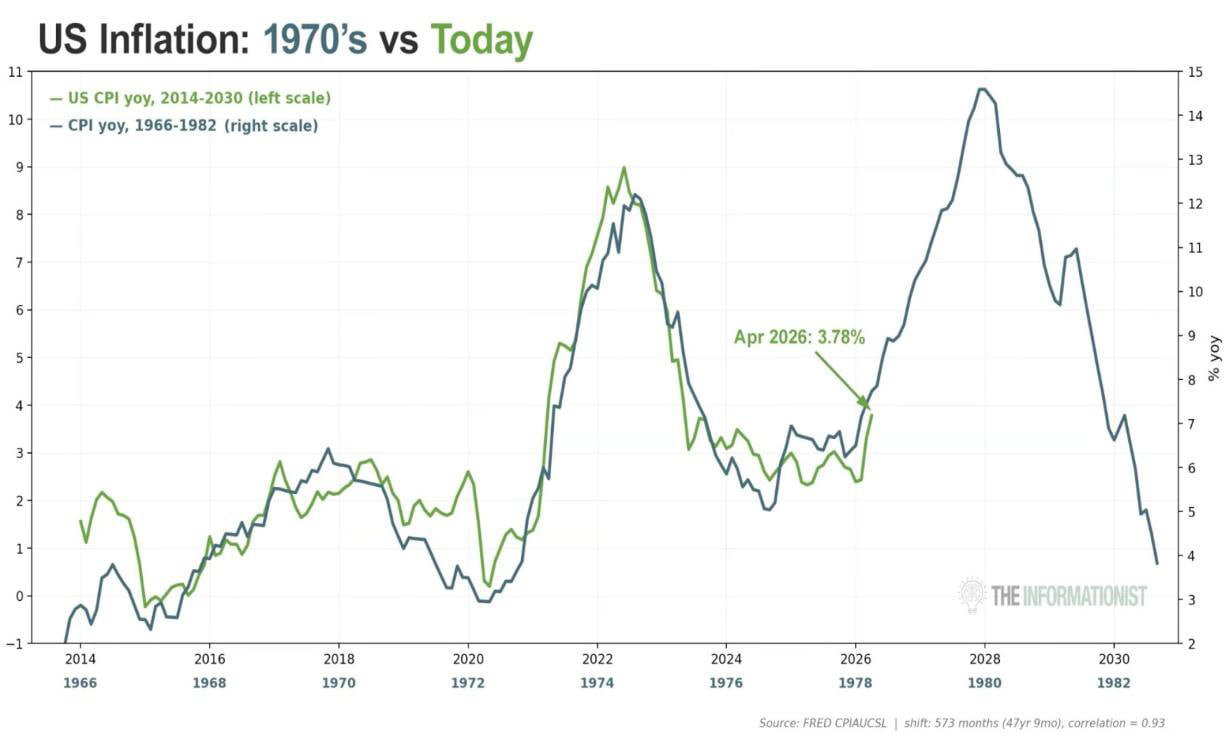
Economists biggest fear… Current US CPI trends have closely mirrored the path from 1966–1982, with a reported correlation of 0.93. Such a high correlation suggests that underlying inflation dynamics—such as wage pressures, persistent services inflation, and policy lags—may again be underestimated, increasing the risk that inflation proves far more stubborn than markets currently price in.
Economists' biggest fear: US CPI mirrors 1966–1982
We share clear, data-informed perspectives on global markets, commodities, and portfolio ideas—from market breadth and macro drivers to the future of real assets like tokenized gold. Our goal is to turn noisy headlines into actionable insight you can actually use. If you’re looking for concise explainers and thoughtful analysis, you’re in the right place.
Author:Herculis Gold Coin ($XAUH)
•cpiinflation1966-1982